AGILITY
Project overview
Helping network engineers get to a first hypothesis faster
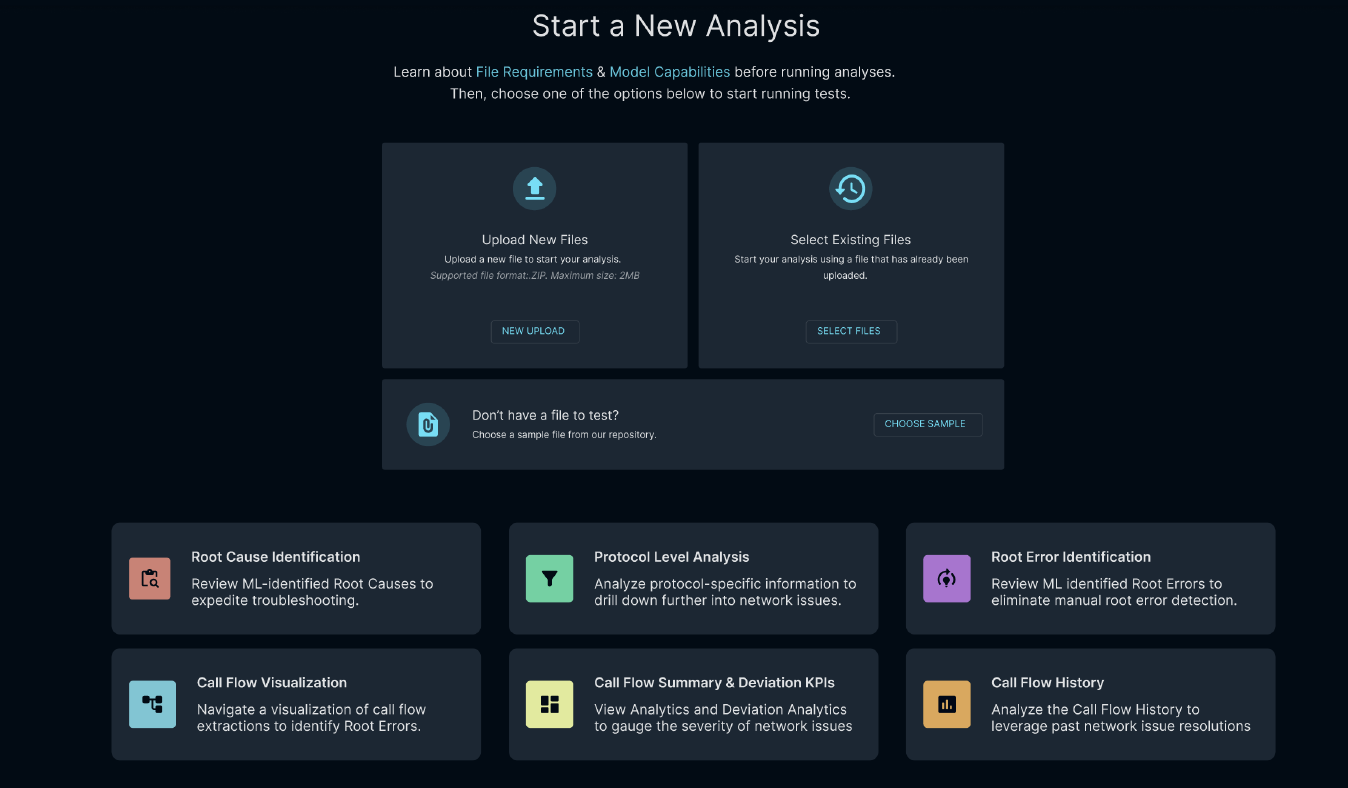
AGILITY uses machine learning to flag potential root errors in network traffic. Engineers can trace a failure through an interactive call flow, inspect protocol details, and use the history of past analyses to investigate similar problems. I focused on starting an analysis, connecting data sources, and finding where a call failed.
As lead UX/UI designer, I worked with network engineers, developers, and the product manager to map the investigation and integration journeys, prototype the changes in Figma, and review their impact.
01
Research Methodology
I used three methods to understand where engineers lost time and why. I then reviewed support tickets and time on task to assess the changes.
Heuristic evaluation
I mapped the information architecture and compared the signed-in and signed-out paths. They were nearly identical, which shifted my focus to the analysis page, where engineers spent most of their time. The review exposed a concrete navigation problem: engineers had to scroll horizontally through long sequence diagrams and select failed calls by hand before they could inspect them.
One-on-one interviews
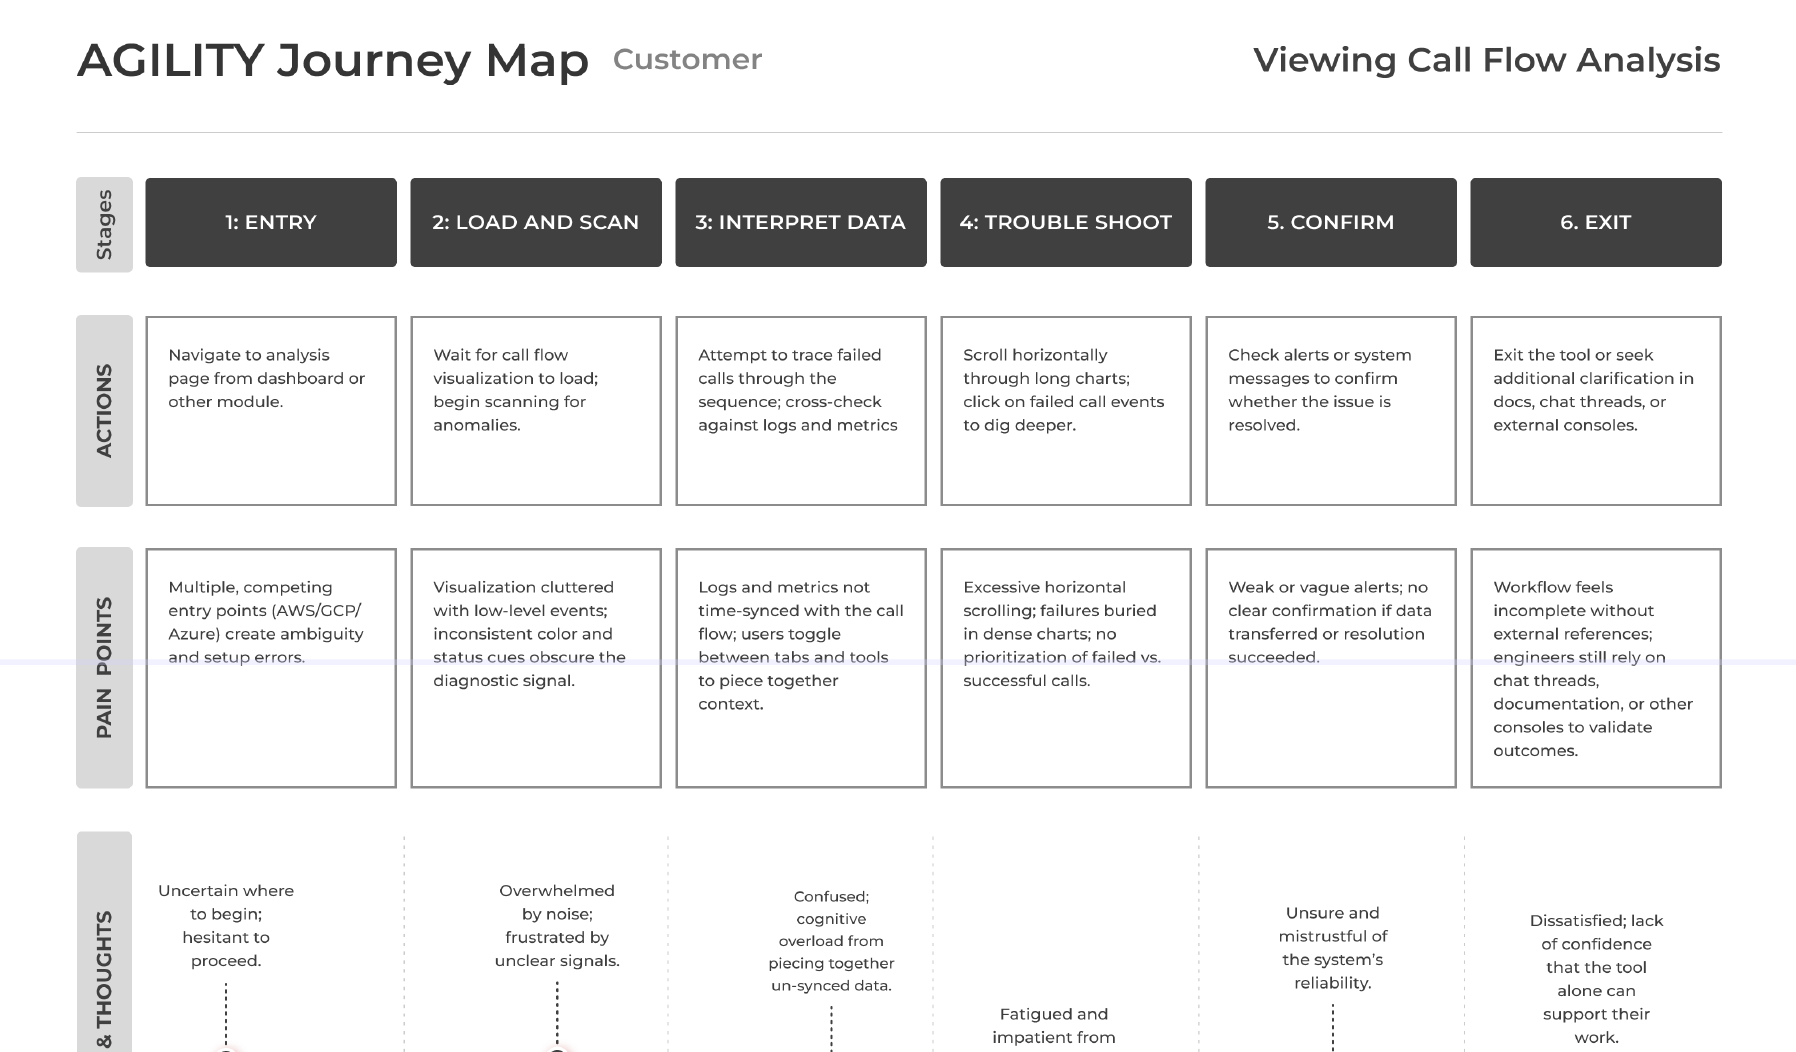
I interviewed network engineers to understand what happened outside the interface. They described switching between cloud consoles, documentation, and chat to complete one integration. Duplicate or missing data and weak alerts made it hard to confirm that a transfer had worked. Competing entry points also led engineers to start steps out of order or abandon setup.
Journey mapping
I synthesized the review and interviews in a Figma journey map, following engineers from entry and initial scan through interpretation, troubleshooting, confirmation, and exit. The map showed where the handoffs broke down and helped us prioritize three moments: starting an analysis, verifying a data connection, and finding the failing step.
02
Starting an Analysis
Research insight. Competing entry points made it unclear where to start and led engineers to take steps out of order.
From home-screen shortcuts to a dedicated page
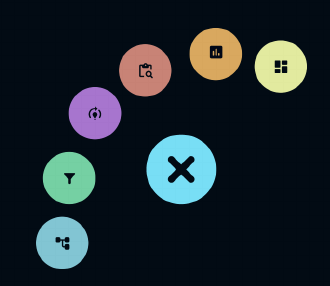
The original home-screen entry opened a slide-down panel that competed with recent activity and help content. I tried a plus button that revealed a spread of shortcut icons, but the icons needed more explanation and the interaction felt out of place during troubleshooting. The next draft used a folder-style button and a modal with descriptive options. It was clearer, but still required an oversized trigger and several steps to begin.
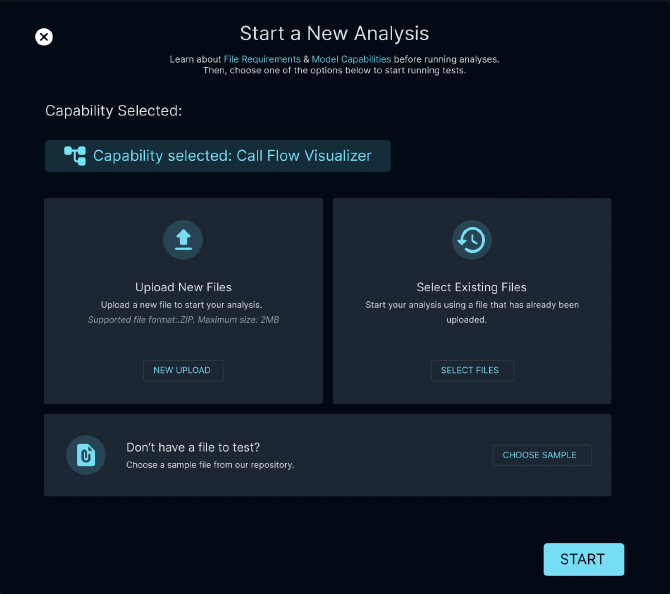
Design decision. I moved Start Analysis to its own page. File requirements and model guidance sit above three explicit choices: upload a capture, reopen an existing file, or try a sample. The dedicated page gave those choices room without adding more weight to the home screen.
03
Connecting Data Sources
Research insight. Setup was split across tools and teams. Engineers could complete the steps and still be unsure whether data was coming through.
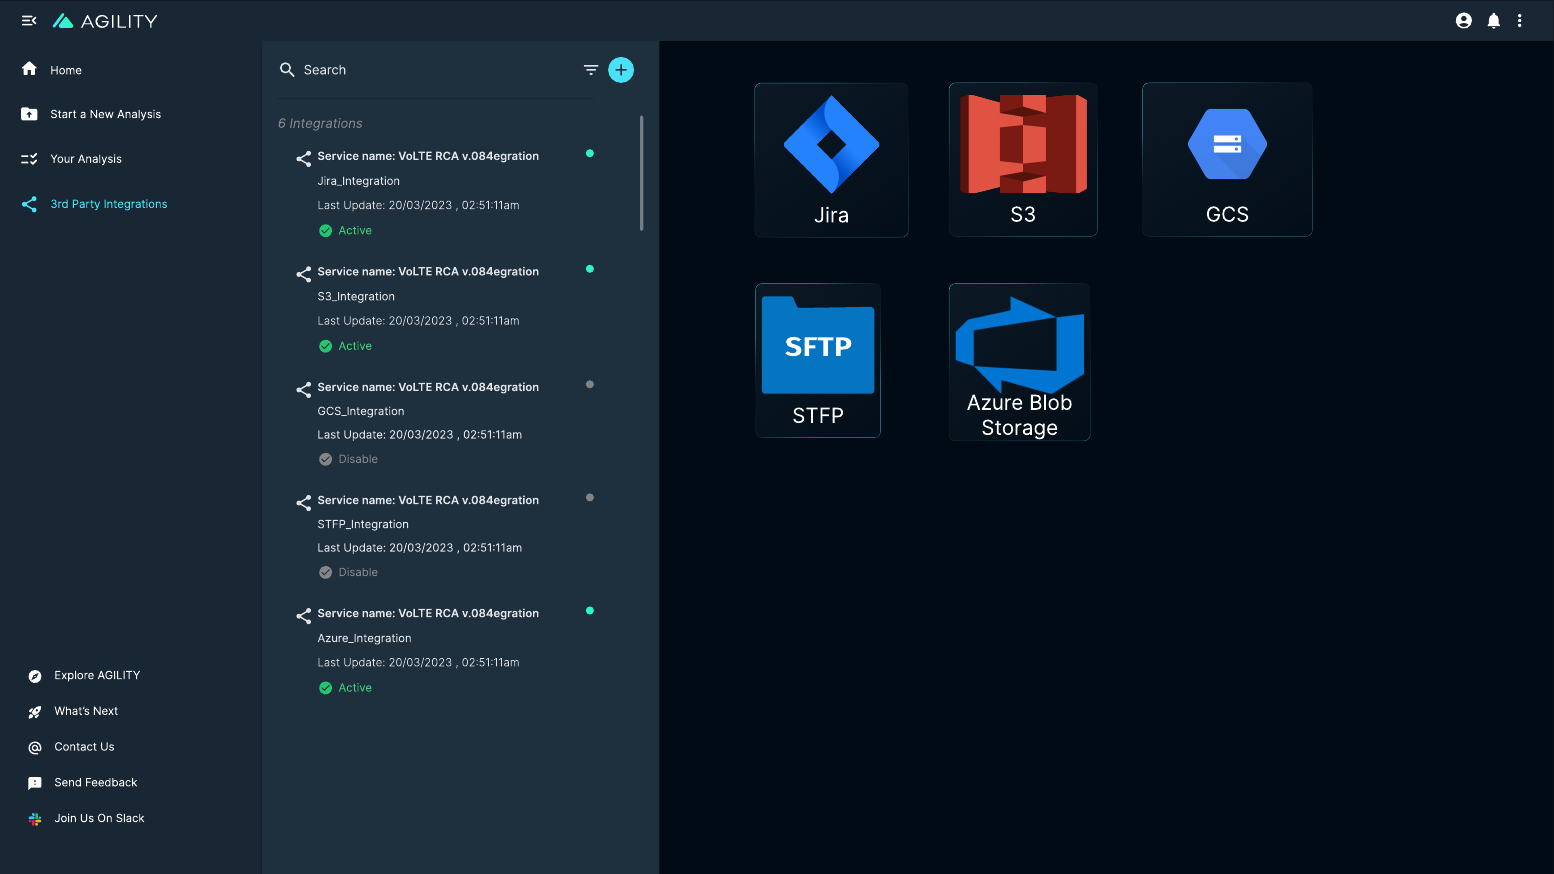
I worked with engineers and developers on API onboarding and cloud storage connections, including Azure Blob Storage. The first redesign surfaced existing integrations in a side panel and replaced provider tabs with dedicated setup flows. In the final draft, I added names, connection-type labels, and status indicators to the side panel, and refreshed the provider icons so engineers could recognize their options quickly.
Design decision. The dashboard became the place to verify connection health, spot issues, and act on them. Provider-specific setup kept each sequence focused, while the shared dashboard let engineers see and manage the connections they already had.
 Explore integrations
Close integrations
04
Finding the Failed Step
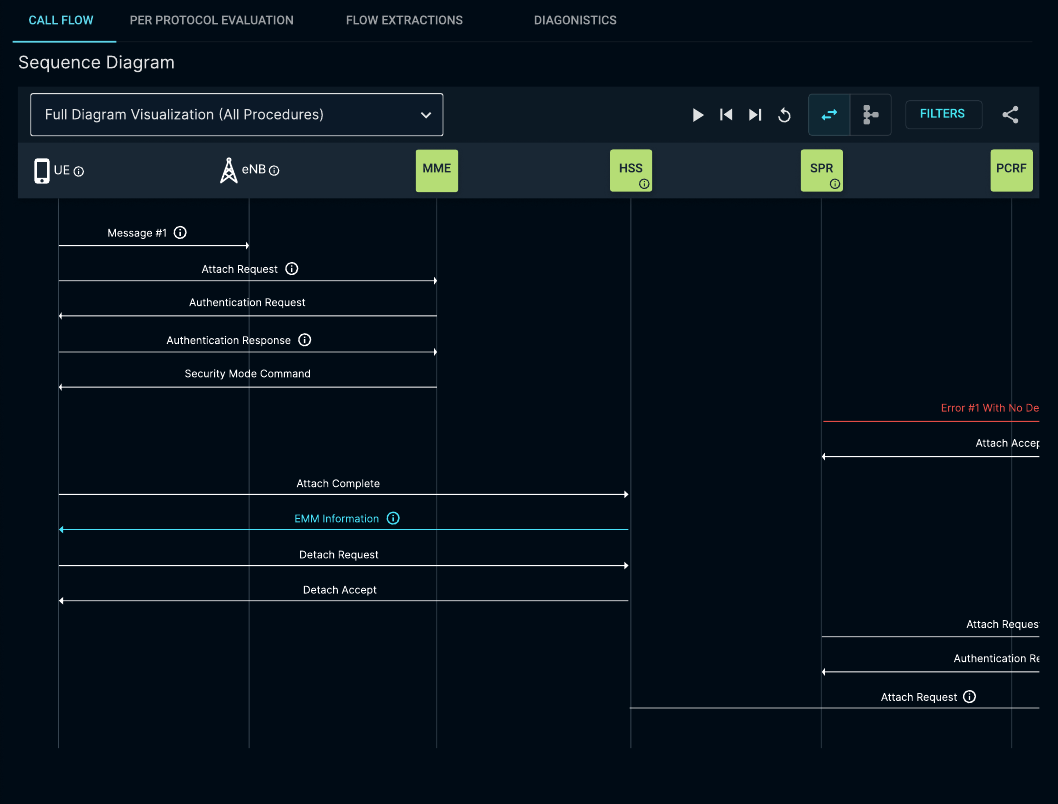
Research insight. Routine protocol messages crowded the sequence diagram, status colours were inconsistent, and logs and metrics were out of sync. Engineers had to find the failure in one view, then manually reconstruct its context in the others.
 Explore diagnostics
Close diagnostics
Design decision. I highlighted the critical path, collapsed routine messages until needed, and standardized status labels and colours with a legend. A shared time cursor aligned the call flow, logs, and metrics. Engineers could start from a flagged step and check whether other signals supported their hypothesis without matching timestamps by hand.
05
Validation
I reviewed support tickets and time on task to assess the three workflows:
- Start Analysis. Engineers took their first action sooner in staging, and fewer tickets asked how to start an analysis.
- Cloud integration. Engineers switched tools fewer times and spent less time on the critical setup task.
- Call-flow diagnostics. Engineers formed a first hypothesis sooner, identified the failing step more accurately, and raised fewer tickets asking where a call had failed.